
Drug development funnel: what I learnt building one from scratch
Thoughts on the cost of failures, the Phase II graveyard, and buying the race rather than the winner

I recently vibecoded this plot in D3.js for a presentation. The funnel plot visualizes the attrition across different stages of drug development and the costs involved. The data and the concept behind this plot are now fairly common knowledge in the field. However, making this plot helped me find a few insights that may not be readily obvious in discussions about drug development costs and failures.
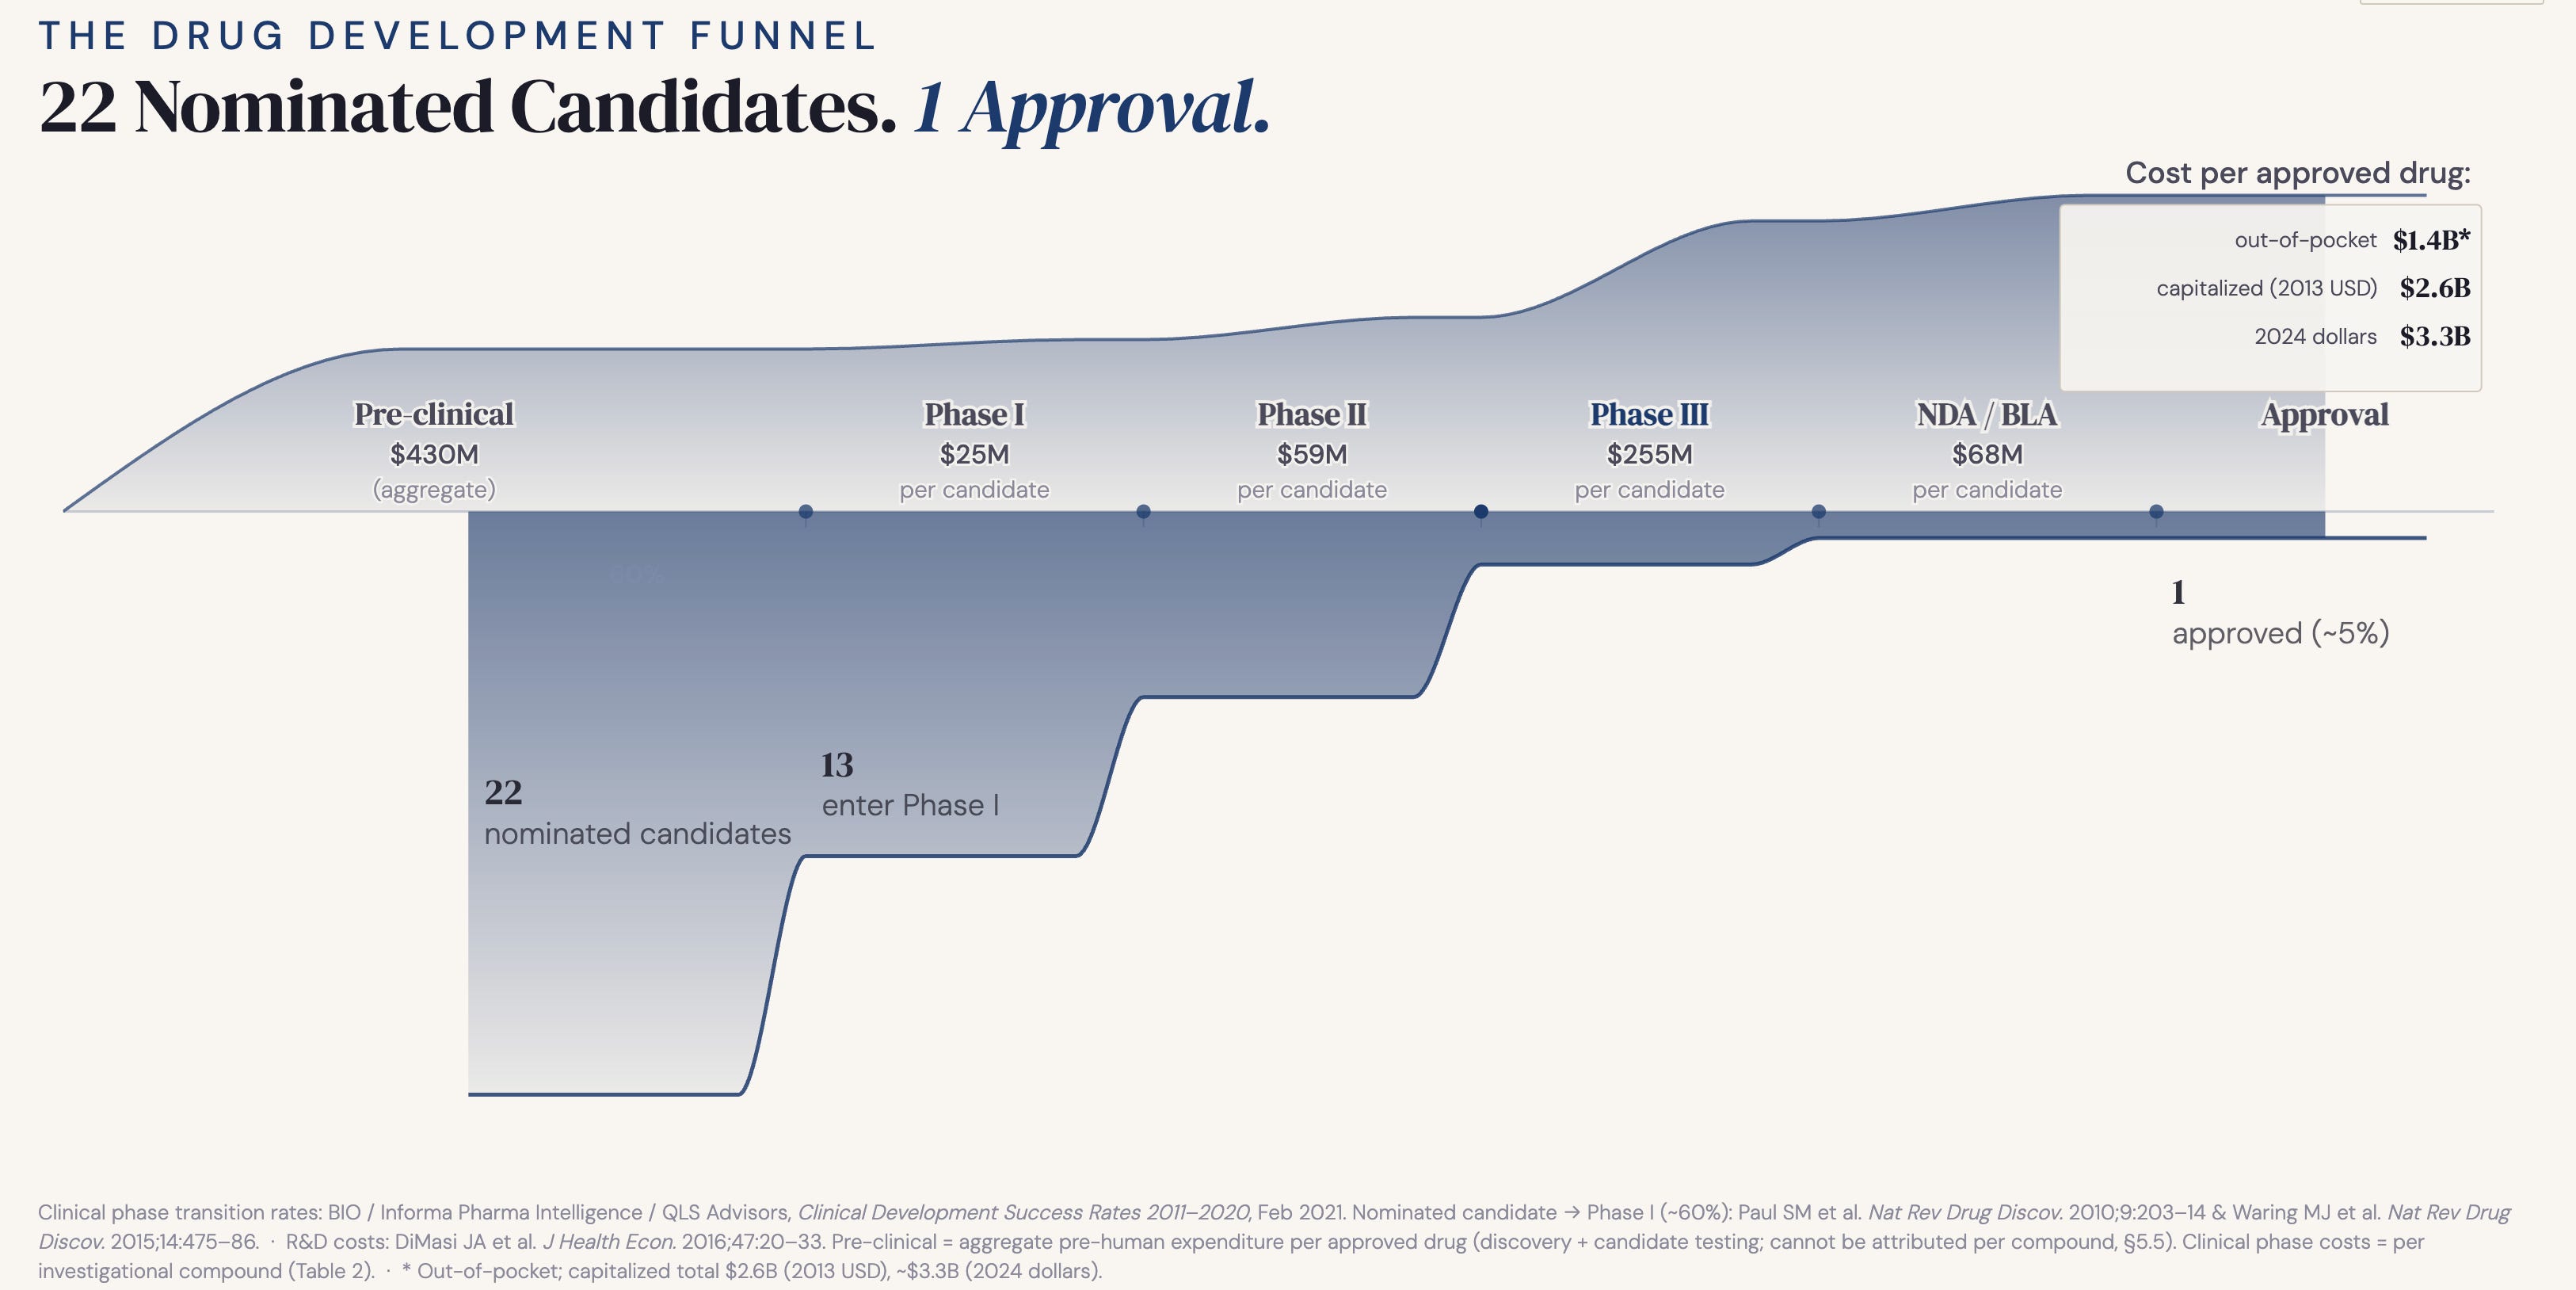
Before I share my insights, let me briefly walk through the plot for context. The plot visualizes the journey of a set of 22 nominated candidates, back-calculated from attrition rates needed to reach one approved drug, through the phases of development. The midline spine marks the stages along with cost labels from DiMasi et al. 2016, the industry-standard reference, expressed per approved drug. The upper area curve is the cumulative cost (in 2013 dollars). The lower area curve shows the transition rates based on data from BIO/Informa (2021), Paul et al. (2010) & Waring et al. (2015) Nat Rev Drug Discov.
Cost of failures, not success
The most quoted number in drug development is also the most misunderstood one. When people say it costs billions to develop a drug, they picture a single molecule being shepherded from lab bench to pharmacy shelf at enormous expense. That is not what the number means. The billions are not the cost of one success. They are the cost of failures—all the failures that were necessary to produce that one success. Every candidate that got nominated, tested and quietly abandoned contributed to that figure. The billion-dollar headline is a measure of failures a company must stomach for one success.
The invisible part of the funnel
Most widely discussed failure rates in drug development start the clock at Phase I. That is actually a generous starting point. Before a drug ever touches a human, it survives a brutal pre-clinical filter that never gets a mention. Based on the limited data available, around 40% of formally nominated drug candidates never make it to human trials. The famously quoted “1 in 10” drug success rate does not count the preclinical attrition. If you factor it in, the odds of success drop to 1 in 22.
And even 1 in 22 is still optimistic as it starts counting only from formal nomination. Before that there are phases like target exploration, hit identification and lead optimization. That earlier funnel, from first exploration to nominated candidate, is almost impossible to quantify at an industry level. It lives inside company R&D pipelines and remains proprietary. The nominated candidate is already a survivor before it enters the visible funnel. The true odds are therefore likely worse than 1 in 22.
Pre-clinical costs rival clinical
Clinical trials, especially late-stage, have a reputation for being expensive. DiMasi et al. estimates $255M per candidate entering Phase III versus $59M in Phase II and $25M in Phase I. That steep cliff before Phase III is exactly what makes the “funnel”. Every gate before III exists to prevent quarter-billion-dollar mistakes.
But here is what that framing misses. Pre-clinical development is invisible in most cost discussions, yet in aggregate it is not cheap. DiMasi reports $430M out-of-pocket pre-clinical spend per approved drug, which is an aggregate cost spanning the entire pre-human pipeline. The data does not allow a per-compound breakdown. Now compare that to our portfolio-level trial costs: 7 entering Phase II at $59M each is $413M, 2 entering Phase III at $255M each is $510M. The most expensive phase per trial and the most invisible phase in the pipeline cost roughly the same. And nobody talks about the second one.
The Phase II graveyard
If you look closely at the transition rates, one number will stand out: 29% of drugs from Phase II make it to III, the narrowest part of the funnel. The killer here is not safety, it’s efficacy. Waring et al. found that pre-clinical failures are dominated by toxicology (59%) and Phase I failures by safety signals (25%), which makes sense as we have reasonably good early tools for catching dangerous compounds before they cost too much. But Phase II failures are led by efficacy (35%), because there is no pre-clinical substitute for asking whether a drug actually works in humans at therapeutic doses. That question can only be answered in Phase II, expensively, after millions have already been spent getting there.
The implication here is to invest disproportionately in early efficacy signals not because safety does not matter, it does. But it usually declares itself early. Efficacy ambushes you late during the most expensive phase before III, and by then the bill is already large.
Buying the race, not the winner
We often come across news of billion dollar acquisitions in the biotech field, which might make you wonder how all that we discussed so far applies there. A company that began with just one target successfully navigated their way into late stages of trials and got acquired for billions of dollars. On the surface it might look like one company is being bought for their one success. But that’s not the full story. That company is just one survivor out of dozens if not hundreds of parallel single-target companies that ran a similar race and quietly failed. They never show up at the deal table, but in reality they are all priced in. The buyer is not paying for what that one company spent. It’s also paying for what other failed companies spent in that target space. The truth is the market ran a portfolio experiment across many bets, and this acquisition settles the tab. Whether the winner got there by conviction or pure luck does not matter. What matters is the buyer bought their way to the end of the funnel by paying what it would have cost to run the race themselves across hundreds of candidates.
Not broken. By design.
It is worth stepping back and wondering if the funnel reflects a broken system that needs fixing. Of course, not. The shape you see is not a failure of the system, it is rather a deliberate design of drug development. The logic is front-loading of attrition: fail cheap, fail fast, and invest heavily only in the survivors. Pre-clinical cuts are inexpensive. Phase I cuts are manageable. By the time you reach Phase III and spend a quarter of a billion per compound, make sure your earlier gates have done brutal and honest work.
The funnel is not broken. But its shape does raise an uncomfortable question: are early filters aggressive enough? Every weak candidate that slips through the early gates carries an expensive price tag before it eventually fails anyway. The cost of a leaky funnel is not just the money. It is the time, the patients enrolled in trials for drugs that should not have made it that far, and the opportunity cost of resources not spent on better candidates.
References:
1. Paul SM, Mytelka DS, Dunwiddie CT, Persinger CC, Munos BH, Lindborg SR, Schacht AL. How to improve R&D productivity: the pharmaceutical industry’s grand challenge. Nat Rev Drug Discov. 2010;9(3):203–14. PMID: 20168317.
2. Waring MJ, Arrowsmith J, Leach AR, Leeson PD, Mandrell S, Owen RM, Pairaudeau G, Pennie WD, Pickett SD, Wang J, Wallace O, Weir A. An analysis of the attrition of drug candidates from four major pharmaceutical companies. Nat Rev Drug Discov. 2015;14(7):475–86. PMID: 26091267.
3. DiMasi JA, Grabowski HG, Hansen RW. Innovation in the pharmaceutical industry: new estimates of R&D costs. J Health Econ. 2016;47:20–33. PMID: 26928437.
4. BIO, Informa Pharma Intelligence, QLS Advisors. Clinical Development Success Rates and Contributing Factors 2011–2020. Industry report; February 2021.